
.svg)
.svg)


.png)


Developed by Henry L. Gantt in the early 20th century, Gantt charts have become an indispensable resource for managers, teams, and individuals across various industries.
They offer a clear and organized way to manage projects and creative processes, providing numerous benefits that enhance efficiency and productivity.
In this article, we’ll delve into what a Gantt chart is, its advantages, and how it aids in efficient workflow management and project workflow optimization.
What is a Gantt chart?
A Gantt chart is a graphical representation of a project or workflow schedule that displays tasks, activities, and their corresponding timelines in a horizontal bar chart format.
Each task is represented as a bar, with the length of the bar indicating its duration, and the positioning of the bar along a timeline shows when the task is scheduled to start and finish.
Gantt charts can be used to manage a wide range of projects, from construction and manufacturing to software development, marketing campaigns, event planning, and even creative endeavors like video production and design projects.

Components of a Gantt chart
A Gantt chart consists of several key components, each serving a specific purpose to visually represent and manage a project's timeline and tasks. Here are the main components of a Gantt chart:
Task list or Work Breakdown Structure (WBS)
The task list or WBS is typically the leftmost column of the Gantt chart. It contains a list of all the individual tasks or activities that need to be completed as part of the project. Each task is usually assigned a unique identifier and a descriptive name to make it easily identifiable.
Timeline or Time scale
The horizontal axis of the Gantt chart represents time. It is typically divided into days, weeks, months, or other relevant time units depending on the project's duration and complexity. This timeline provides a visual reference for when tasks are scheduled to occur.

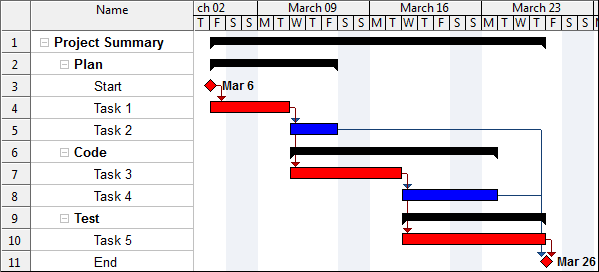
Task bars
The heart of the Gantt chart consists of horizontal bars, also known as task bars or Gantt bars, that correspond to individual tasks in the task list. Each task bar is drawn on the timeline to represent the start and end dates of the task. The length of the bar indicates the duration of the task, while its position along the timeline represents the task's scheduling within the project.

Task dependencies
Arrows or lines connecting task bars illustrate task dependencies. These lines indicate which tasks must be completed before others can start. Task dependencies are crucial for establishing the sequence of work and ensuring that the project flows smoothly. For example, if Task B depends on Task A, there will be a line connecting the end of Task A to the start of Task B.

Milestones
Milestones are significant points or achievements within the project that do not have a duration but mark a key event. They are often represented as diamond-shaped symbols on the Gantt chart. Milestones are essential for tracking critical project achievements, such as project kickoff, client reviews, or project completion.

Progress bars
To track task progress, some Gantt charts use shaded or partially filled task bars to indicate how much of a task has been completed. This visual representation helps project managers and team members quickly assess which tasks are on track and which may require attention for critical project planning.

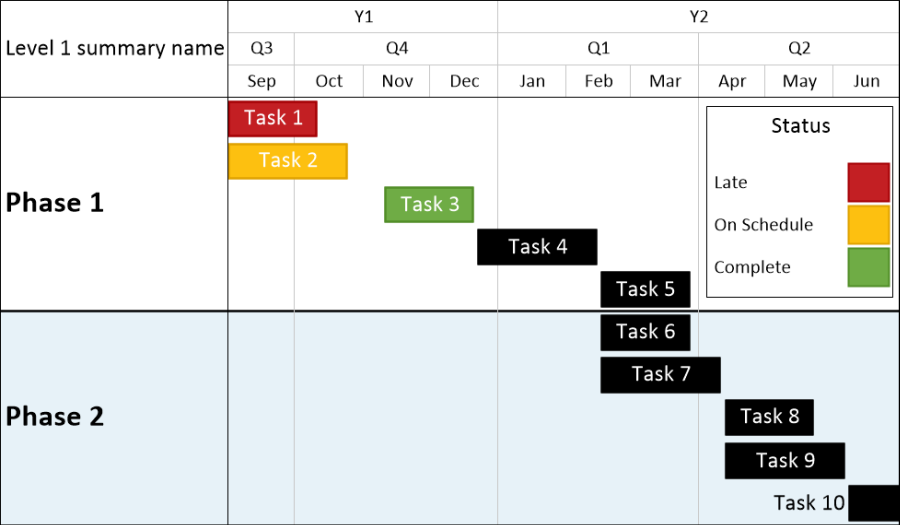
Legend/Key
A legend or key is often included within the Gantt chart to explain the symbols and colors used to represent various elements such as tasks, dependencies, milestones, and progress. This helps ensure that anyone viewing the chart can easily interpret its contents.
Baseline
A baseline is a snapshot of the original project schedule before any work begins. It serves as a reference point for comparing planned vs. actual progress. Some Gantt charts display the baseline schedule alongside the actual schedule for easy comparison.
Critical path
The critical path is a series of tasks that, if delayed, would cause the entire project to be delayed. Some Gantt charts can automatically calculate and highlight the critical path, making it easier to identify the most time-sensitive tasks.
Benefits of using Gantt charts
Gantt charts provide an array of benefits in effective project planning and project workflow optimization, including improved visibility, better planning and scheduling, effective communication, and the ability to monitor progress and address issues promptly.
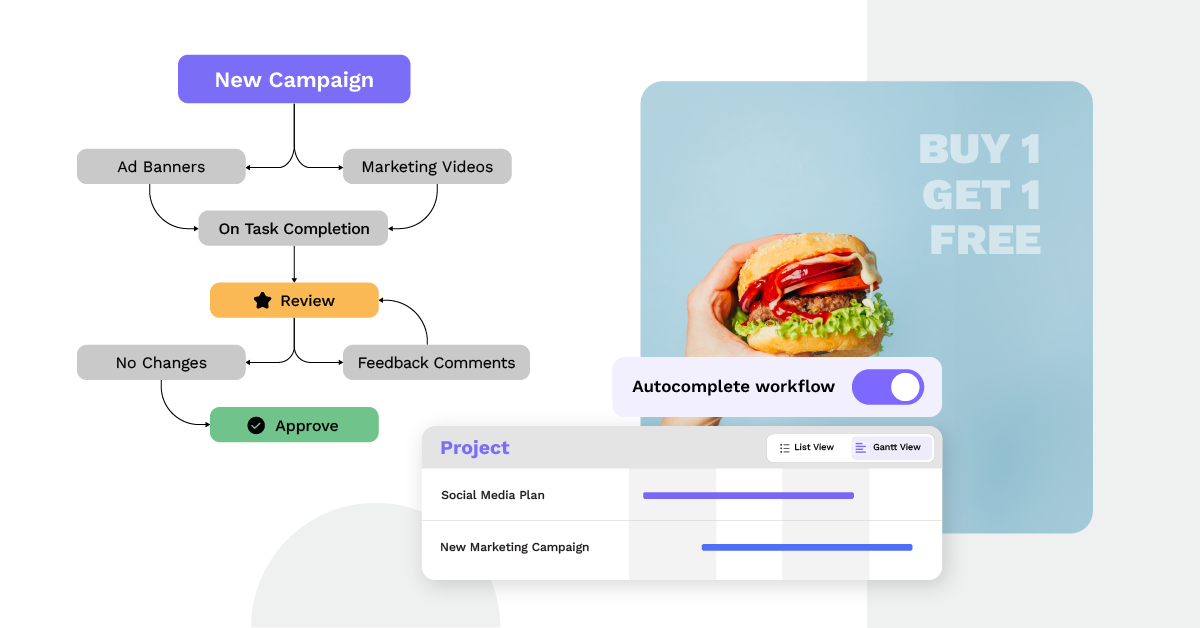
For creative and marketing teams, Artwork Flow’s workflow management feature comes with a Gannt chart to help streamline creative workflows.
Visual clarity
Gantt charts offer a visual snapshot of the entire project or workflow, making it easy to understand the sequence of tasks, their dependencies, and the overall timeline. This visual clarity enhances communication and ensures that everyone involved has a shared understanding of the project's progress.
Task sequencing and dependencies
Gantt charts allow you to define task dependencies, indicating which tasks must be completed before others can start. This feature helps in establishing a logical order for tasks, preventing bottlenecks, and ensuring that the project proceeds smoothly.
Time management
Gantt charts enable precise scheduling of tasks and activities, helping project managers allocate resources efficiently and avoid overloading team members. By allocating realistic timeframes, teams can better manage workloads and meet deadlines.
Efficient allocation of resources
Gantt charts assist project managers in optimizing resource allocation. By visualizing when each task is scheduled, managers can allocate personnel, equipment, and materials more efficiently. This prevents resource overallocation or underutilization, leading to cost savings and better workforce management.
Realistic timelines for task completion
Gantt charts enable project managers to set realistic timeframes for each task. By breaking down the project into individual activities and estimating their durations, project teams can establish achievable deadlines. This ensures that tasks are neither crushed nor overly delayed, helping to meet project milestones and deadlines effectively.
Simplifies complex project information
Gantt charts condense complex project plans into a visual, easy-to-understand format. This simplification is particularly beneficial when conveying project details to non-technical stakeholders or clients who may not be familiar with project management terminology. The visual nature of Gantt charts makes project information accessible to a broader audience.
Facilitates team and stakeholder discussions
Gantt charts serve as a focal point for project discussions and collaboration. Team members can use them to discuss task priorities, timelines, and dependencies, fostering better teamwork and alignment. Additionally, Gantt charts facilitate discussions with stakeholders by providing a visual representation of project progress and potential adjustments needed.
Tracking task completion and deadlines
Gantt charts excel at tracking progress in real time. As tasks are completed, the corresponding bars are updated, making it easy to see which tasks are on schedule and which may be falling behind. Project managers can use this information to ensure that work is progressing as planned and take action if deadlines are at risk of being missed.
Identifying and addressing delays promptly
When delays or deviations from the original plan occur, Gantt charts allow for quick identification and mitigation. Project managers can pinpoint the source of delays, adjust task dependencies, allocate additional resources, or rearrange the schedule as needed to minimize the impact on the overall project timeline. This proactive approach helps in keeping projects on track and mitigating potential risks.
Wrapping up
Gantt charts, developed by Henry L. Gantt in the early 20th century, have evolved into a fundamental tool in project management and creative workflows.
Their ability to provide a clear, organized visual representation of a project's timeline and tasks makes them invaluable for planning, scheduling, and tracking progress.
By offering insights into task dependencies, resource allocation, and critical paths, Gantt charts facilitate better communication, efficient time management, and proactive problem-solving.
For creative teams, tools like Artwork Flow's workflow management feature with an integrated Gantt chart can significantly streamline creative processes, blending structure with creativity for optimal project outcomes.


.png)
.jpg)


.webp)


